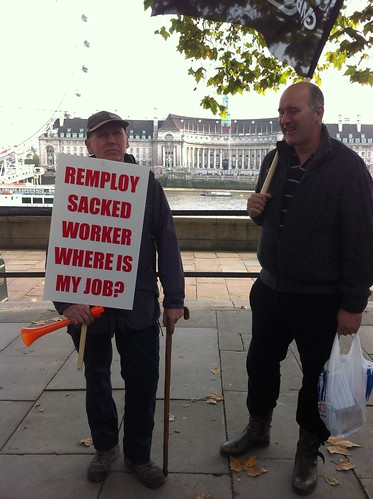
The DWP have estimated between 310,000 and 500,000 disabled people will
lose all support following the reforms to Disability Living Allowance, which will only affect working-age
disabled people, including the 2,010,000 who currently claim DLA.
These
are not (all) fraudulent claimants – at least 209,500 non-fraudulent DLA
claimants will lose out - assuming every one of the fraudulent claimants is weeded out during the reassessment process. (The DWP estimates that 0.5% of DLA claimants are
fraudulent. 2,010,000 x 0.5% = 100,500. 310,000 – 100,500 = 209,500. The higher figure is 500,000 - 100,500 = 400,500 disabled people losing benefit support)
I’ve spent Sunday afternoon using DWP reported figures to
work out:
a) the current numbers of working-age disabled people
getting each combination of DLA rates
b) what the new PIP regime will look like in terms of
different types of claimant
c) from that, where the cuts will come from to reduce the
numbers of claimants by 310,000
Total number of claimants = 3,203,000
Number of working age claimants = 2,010,000
Number of claimants under 16 = 335,000
Number of pensioners = 857,000
Percent of claimants that are working age = 2,010,000 /
3,203,000
= 62.7%
I will round to 63%
63% of current budget £12,000,000,000 x 0.63
= £7,560,000,000
£7,560,000,000 / 2,010,000 = £3,779
Average of total budget
spend per claimant = £3,779
PIP will have 20% decrease in total budget = £9,600,000,000
PIP is only for working age claimants. Pension age claimants
will continue to get DLA, and not be reassessed for PIP.
Only working age claimants affected by change to PIP. So
100-63% = 37% of CURRENT budget must go to claimants not of working age (children and pensioners). = £4,440,000,000
Amount left for working age claimants will be
£9,600,000,000 – 4,440000,000 = £5,160,000,000
£5,160,000,000 / 2,000,500
= £2,579 per head
So if the total
number of DLA claimants simply transfers to PIP, each claimant will, on
average, lose £1,200 a year, or £100 a month.
However, the DWP itself accepts that will not happen - people will lose their benefit support.
Who currently gets
DLA and at what rates?
These are the current numbers of people getting each combination
of DLA rates.
|
Lower Rate Care
|
Middle Rate Care
|
Higher Rate Care
|
Care – no award
|
Lower Rate Mobility
|
LRM & LRC
|
LRM & MRC
|
LRM & HRC
|
LRM
|
190950
|
347730
|
122610
|
80400
|
9.50%
|
17.30%
|
6.10%
|
4.00%
|
Higher Rate Mobility
|
HRM & LRC
|
MRC & HRM
|
HRC & HRM
|
HRM
|
271350
|
271350
|
299490
|
184920
|
13.50%
|
13.50%
|
14.90%
|
9.20%
|
Mobility – No Award
|
LRC
|
MRC
|
HRC
|
XX
|
188940
|
42210
|
8040
|
0
|
9.40%
|
2.10%
|
0.40%
|
0%
|
Table 1 – percentage
of working age claimants getting each combination of DLA rate and number of
claimants at each rate.
Figure in middle cells indicates number of claimants,
calculated using total number of working age claimants = 2,010,000, and
percentage provided in table 8 of referenced document. Some rounding has
clearly been used in the DLA Table 8 as the percentages do not add to 100%, and
total claimants is 2,007,990.
This is my estimate of how PIP will look – based on some
assumptions described beneath the table.
.
|
Care – standard rate
|
Care – enhanced rate
|
Care – no award
|
Mobility – standard rate
|
C-SR & M-SR
12%
|
C-ER & M-SR
15%
|
M-SR
6%
|
Mobility – enhanced rate
|
C-SR & M-ER
12%
|
C-ER & M-ER
23%
|
M-ER
15%
|
Mobility – no award
|
C-SR
14%
|
C-ER
3%
|
XX
|
Table 2 – estimated
proportions of PIP claimants by rate, projected from DLA proportions.
Note. I have estimated the proportions of people receiving
PIP based on the following assumptions and evidence:
The reforms claim to be helping those in greatest need – so
I’ve increased the proportion getting enhanced rate benefits slightly, and assumed some lower rate claimants will lose out. Also, people who can "mobilise" effectively may be considered not in need of mobility support. "mobilise" includes using a wheelchair.
There are fewer rates to choose from, so I’ve combined DLA
claim proportions to map across to PIP (e.g. MRC & HRC have combined to
C-ER)
Total projected number of PIP claimants in the DWPs analysis
is 1,700,0002
|
C-SR
|
C-ER
|
C-None
|
M-SR
|
204000
|
255000
|
102000
|
M-ER
|
204000
|
425000
|
255000
|
M-none
|
238000
|
51000
|
XX
|
Table 4 – estimated
number of PIP claimants by rate, calculated from reference 2 figure of
projected PIP numbers 2015 = 1,700,000.
|
C-SR
|
C-ER
|
C-None
|
M-SR
|
204,000
DWP – 250,00
|
255,000
DWP -110,000
|
102,000
DWP-230,000
|
M-ER
|
204,000
DWP-190,000
|
425000
DWP -340,000
|
255,000
DWP -230,00
|
M-none
|
238,000
DWP-250,000
|
51,000
DWP- 90,000
|
XX
|
Many additional types of support are “passported” from
DLA.
Not all DLA claimants will be able to access all of these things - they are dependent on DLA rate awarded, economic need, area of the country the claimant lives in, amongst other things.
* Enhanced Housing Benefit rates to account for need for extra room for carers or equipment
* Someone getting Carer's Allowance for looking after someone on DLA will lose that Carer's Allowance
* Concessionary travel schemes - Freedom Pass,
local bus passes and the National Rail Disabled Person’s Railcard, M6 toll
pass, London Congestion Zone exemption
* Motability funding so disabled people can afford adapted
cars.
* Blue Badges for disabled parking
* Access to some local council support
* Discounted access to gyms and leisure centres
* discounted or free tickets at some galleries, museums, cinemas and theatres for
your carer, so you don’t have to pay extra to go out, just because you can’t go
alone.
* Higher rate mobility DLA claimants can learn to drive at 17, and get free car tax.
* Warm Home rebate from some energy suppliers.
* Enhanced Income Support levels to account for increased costs of life with impairment
Edit: Oh, and best estimate of fraudulent claimants is 0.5%, or 1 claimant in 200.